Subscribe to receive future updates, new wildfire research, and analysis directly by email.
Have questions, feedback, or collaboration ideas? Get in touch directly.
Independent Model Validation of Oregon’s Wildfire Hazard Map
A data-driven evaluation that revealed key flaws in the state’s wildfire risk model — findings that helped influence public policy and legislative change.
Overview
After his property was labeled high wildfire risk, Jeremy Kauwe independently reviewed Oregon’s wildfire hazard map. He taught himself the necessary tools, cleaned the state’s data, and checked the model against historical fire records. The review surfaced major accuracy and fairness issues. He then translated the findings for the public and lawmakers, helping build support that ultimately led to the map’s repeal.
Approach
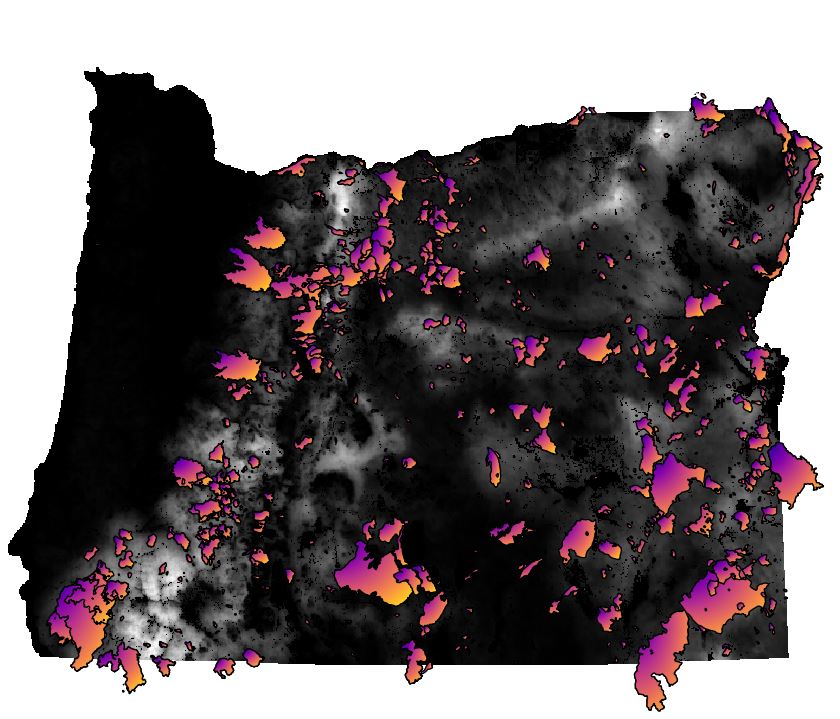
I compared the model’s burn risk outputs to the historical fire records it was built on. The data arrived in disconnected map files, so I learned GIS basics, aligned the layers, and built a consistent statewide grid for a fair comparison. I organized the results into a clear, repeatable dataset and evaluated how well the model separated fire from non-fire locations. The analysis showed weak predictive value, and I published the method and results publicly for transparency.
Results
The model performed no better than chance when checked against its own historical training data. I also found that the “high-risk” cutoff was set using a narrow subset of properties, which inflated the number of homes labeled high risk statewide. This meant far more than the intended top 10% were flagged. I shared the evidence through a public website and town halls, including a briefing for Senator Jeff Golden, who later supported the map’s repeal.
Challenges
I started with no GIS background, so I had to quickly learn new tools while handling messy, mismatched map files. Processing large datasets on a local machine caused frequent slowdowns and crashes. Another challenge was making the findings clear to non-technical audiences. I leaned on visuals and plain-language explanations so community members and policymakers could understand the implications and act on them.
Project Links
Tags
- Statistical Consulting
- Machine Learning
- Model Validation
- Precision-Recall AUC
- QGIS
- Geospatial Analysis
- Wildfire Risk Modeling
- Wildfire Map Audit
- Oregon Wildfire Map
- Policy Impact